WIEAT
Web-based Interactive Episode Analysis Tool
fetch('https://wieat.vercel.app/api/interactions', {
method: 'post',
body: JSON.stringify({
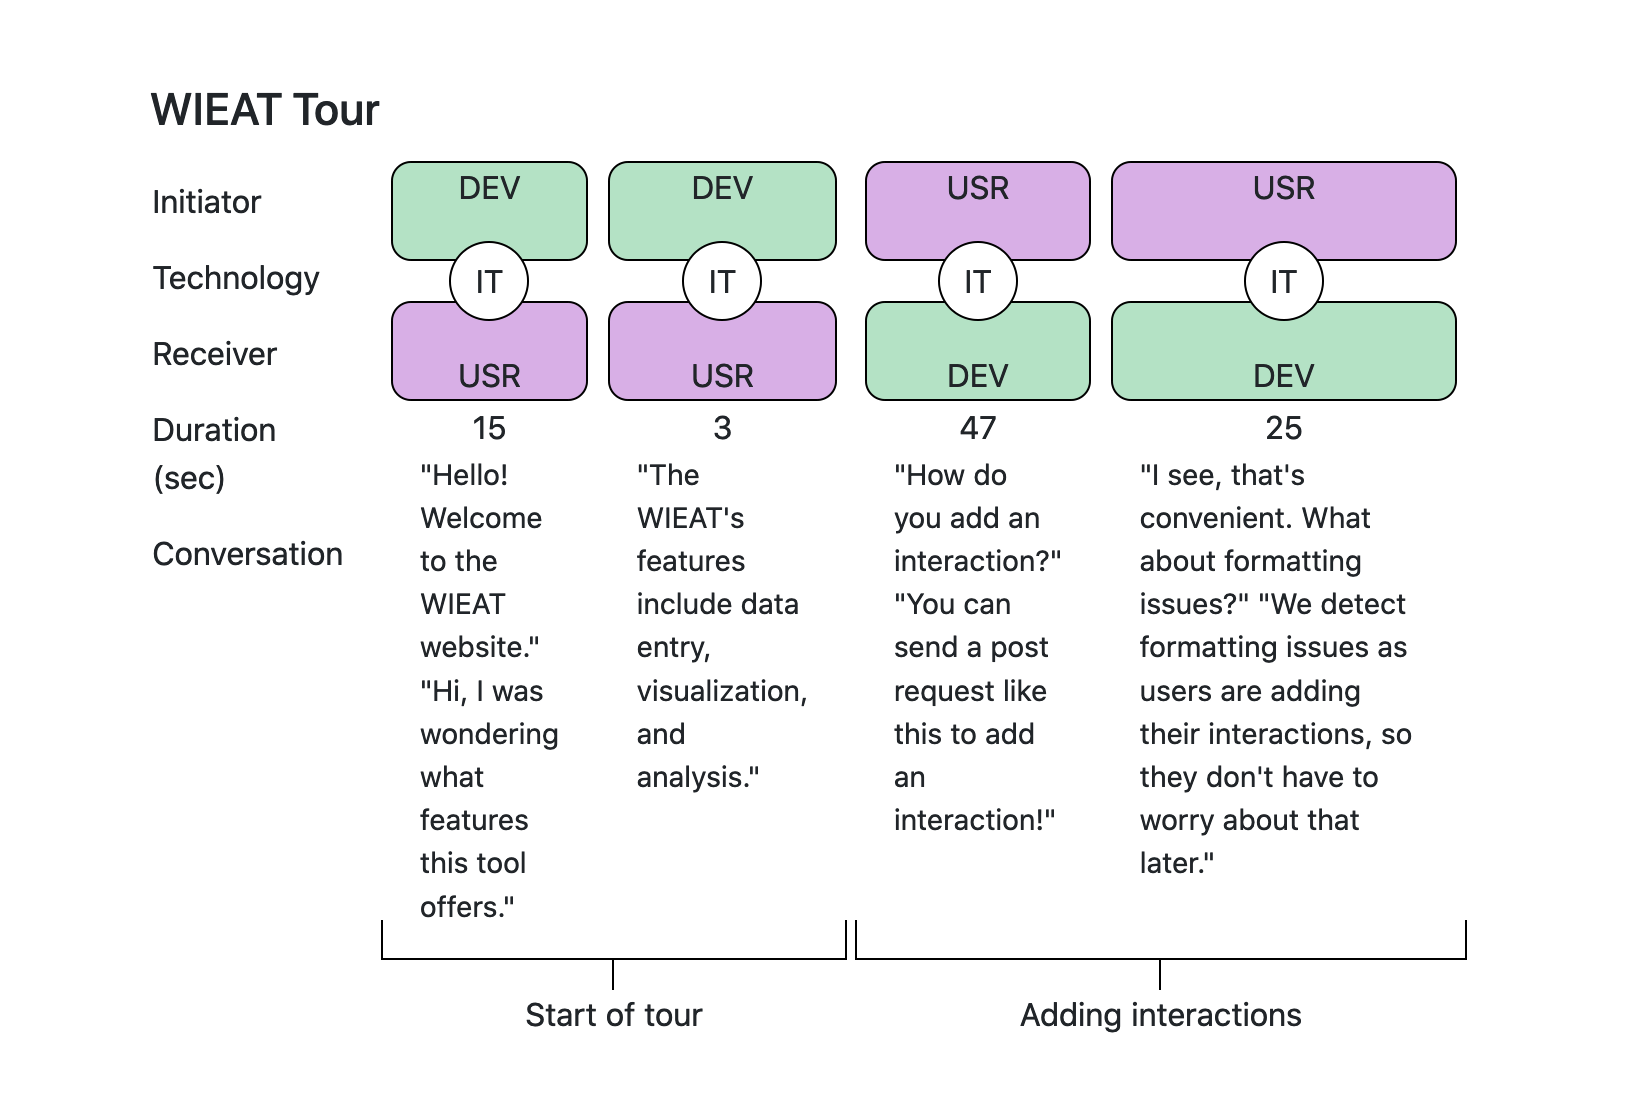
start_time: "21:04:24",
end_time: "21:05:11",
duration: 47,
initiator: "USR",
receiver: "DEV",
technology: "IT",
conversation: "\"How do you add an interaction?\" \"You can send a post request like this to add an interaction!\"",
sub_episode: "Adding interactions",
episode: "WIEAT Tour"
})
})
Data Entry
Add interactions to the database in multiple ways
- Use a POST request (JS example on the left)
- Manually add an interaction through our data entry page
- Correct any typos from an episode using the update functionality
- Instantly visualize and analyze your data
Add data →